Monday, September 12th, 2022
Visualizing Influence through Centrality Calculations in Gephi
Amid calls to investigate the nature of data and its impact upon the visibility of women, Jacqueline Wernimont’s recommendation that we “parse the relationships between gender and [digital archival] tools” (“Whence Feminism?”, par. 11) is particularly salient to Linked Women Pedagogues. As a data discovery tool, LWP will allow users to create visualizations based on their queries. Once built, LWP’s architecture will need to ensure that its data input mechanisms and its data visualizations help to enhance, rather than flatten, the moveable contours of women’s trajectories, including their so-called major and minor intellectual influences on the field (Graban, “Ripple Effects”; Graban and Sullivan, “New Rhetorics”).
From recent work in both data feminism (D’Ignazio and Klein) and digital rhetorics (VanHaitsma; Boyles) we know that how we curate information, with or without visualizations in mind, matters. All proprietary visualization tools come with affordances and constraints. Our challenge has been deciding whether or not to integrate proprietary tools and that challenge, in turn, has been informed by conversations about centrality, including whether to represent pedagogues or their accomplishments as nodes (visualized as central points of connection) or as edges (visualized as peripheral pathways between points of connection).
In network theory, “centrality” describes a calculation that measures the weight an entity has within a social network, often revealing the entity’s strength of ties to other entities in a particular context (Masías et al., “Exploring the Prominence,” pp. 838-839; Ruegg and Lee, “Epic Social Networks,” p. 147). Typically, centrality measures are calculated in data projects involving deep textual analysis, but even for projects such as Linked Women Pedagogues (LWP) that trace influence among human connections, centrality can provide some additional clarity into how we need visualizations to work.
Because LWP is interested in locatability and migration paradigms, we find value in the calculations of betweenness centrality and eigenvector centrality. For visualization platforms like Gephi, betweenness centrality prioritizes “nodes that are highly influential in connecting otherwise remote regions of a graph,” while eigenvector centrality calculates “the influence of a node” according to the “connectedness of its closest neighbors” (Cherven, Mastering Gephi, p. 15). In other words, betweenness centrality places emphasis upon a node that brings together otherwise distant parts of a network, while eigenvector centrality marks as “central” the points which are tightly connected amongst themselves within the network.
While both calculations are looking for the most influential nodes in a network, the value these calculations place upon the types of connections occurring between different points produces distinct results. It is these distinctions that we observe each time we test a proprietary visualization tool: How can each tool effectively represent influence in a woman’s career when the most central activities occur interstitially, through the ways in which historians query relational data and ephemeral references, and not traditionally, through the indexed presence of circulating objects? Furthermore, is the function of a good visualization tool to highlight distance or to celebrate proximity? Finally, in what subtle and explicit ways do our visualization tools reinforce certain binary logics that, in turn, influence how digital historians engage with their own subjects?
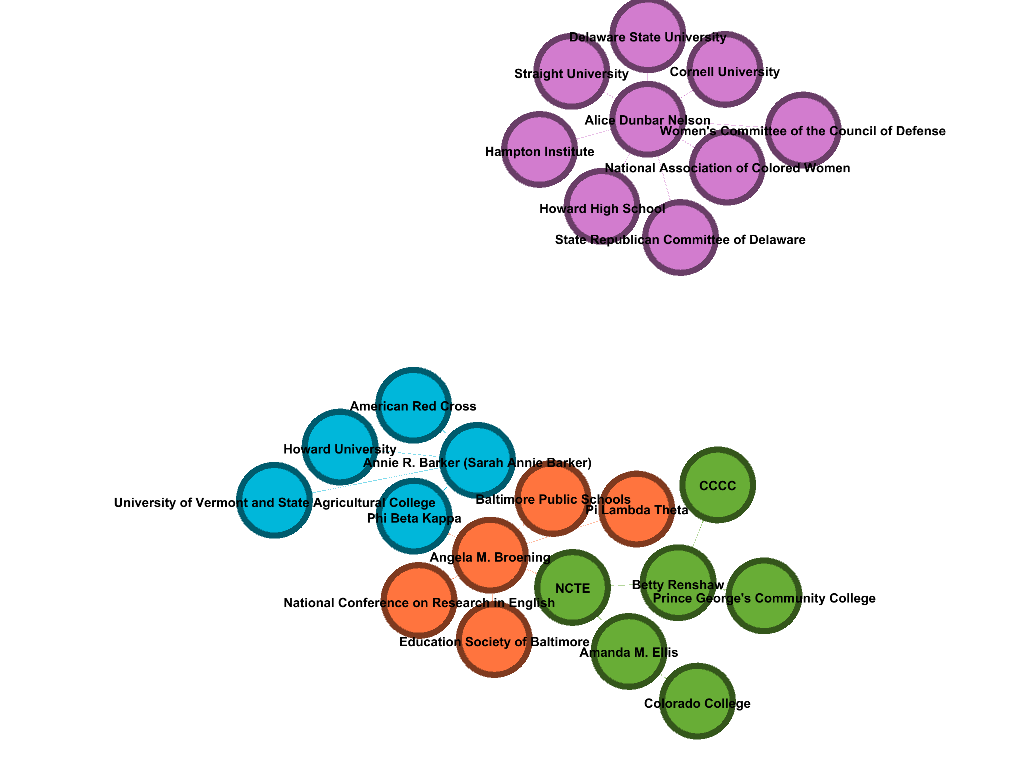
To begin answering these questions, and to examine the impact of different centrality calculations on a network like LWP, Ashley created a Gephi visualization (Fig. 1) that connected five women whose career data we have been collecting: Amanda M. Ellis (1898–1969); Angela M. Broening (1898-1972); Annie R. Barker (bd and dd unknown); Betty Renshaw (bd and dd unknown); and Alice Dunbar Nelson (1875–1935). In Ashley’s initial network visualization, using Gephi’s force atlas layout technique, all five women and their organizational affiliations are represented as nodes. The largest nodes in the network visualization represent the most significant centrality scores for the dataset.

Linked Women Pedagogues data set, demonstrating Eigenvector Centrality
Ashley wanted to know more about how performing two different centrality calculations on the same network might appear to change how a woman is represented within that network. Her next step was to calculate the highest levels of betweenness centrality for all five figures and their corresponding organizations. Table 1 shows the five highest calculations for betweenness centrality occurring for this data set, reinforcing strong ties between three of our five figures and two professional organizations.
| Node | Betweenness | |
| Angela M. Broening | 80.0 | |
| NCTE | 56.0 | |
| Phi Beta Kappa | 44.0 | |
| Annie R. Barker | 39.0 | |
| Alice Dunbar Nelson | 28.0 |
Table 1: The Highest Levels of Betweenness Centrality for 3 of our 5 figures and their involvement in two organizations.
Angela M. Broening has a significantly higher ranking for betweenness centrality compared to Annie R. Barker and Alice Dunbar Nelson, because Broening held a connection to the National Council of Teachers of English (NCTE), Phi Beta Kappa, and at least four additional organizations. As such, the outward strength of her connections is reflected in her ability to pull together a series of nodes that are all distantly connected (Fig. 2). Thus, her high centrality score reflects her node’s ability to pull together affiliations across the network.

By contrast, we can see how the most “central” nodes for the network shift when we look at eigenvector centrality in Table 2 and Figure 3, representing the most connected nodes within their section of the network. While four of the five most central nodes for both eigenvector and betweenness centrality scores remain relatively similar, there is some notable variance. Despite the fact that Angela M. Broening is still highly ranked, Alice Dunbar Nelson—who had the fifth highest score for betweenness centrality—has the highest score for eigenvector centrality by a large margin (Table 2).
| Node | Eigenvector | |
| Alice Dunbar | 1.0 | |
| Angela M. Broening | .734878 | |
| NCTE | .47299 | |
| Phi Beta Kappa | .404438 | |
| Howard High School | .353482 |
Table 2: The Highest Levels of Eigenvector Centrality for 2 of our 5 figures and their involvement with three institutions.
Nelson scored highly not because she has the greatest number of connections but because of the tightness of her connections to institutions such as Delaware State University, the National Association of Colored Women, Cornell University, and Howard High School, places that are connected only to her in this particular data set (Fig. 3).

Eigenvector centrality marks as more central the tightest of bonds while betweenness centrality categorizes as more central the nodes that bring together the most otherwise disconnected parts of the network. When we look at these two different calculations, we see two factors that impact the shape of Gephi visualizations, even across a small data set, and furthermore, we understand that the binary logic (closeness vs. distance, strength vs. weakness) on which these factors depend is not sacrosanct. Once built, we hope that LWP makes these and other visualizing logics more culpable. Determining whether we will map their network connections based on the strength of their closely knit connections or their strength to pull together disparate parts of the network will impact the way that such a model of locatability makes their contributions to our field visible.
— T. Graban and A. Pendleton