Monday, November 1st, 2021
Beyond Clustering: Representing Data through Disjointment
Although Linked Women Pedagogues is not an archive, our project team faces the ongoing challenge of communicating how “intellectual encounters” lend the project its critical value. Thus far, we have argued in several ways. Ideally, intellectual encounters reveal things about historians’ expectations of archived data. Intellectual encounters also create opportunities to visualize how researchers’ motives and affiliations intersect with the topics, subjects, and locations of their research. Most importantly, while most visualization tools assume that we already have data sets to analyze, the process of defining an “intellectual encounter” suggests the need to question the historical biases that bear on how textual, curricular, and programmatic data are designated or classified in the first place.
Put more simply, data ubiquity does not immediately translate to the searchability or locatability of data when it comes to tracing women’s intellectual influence through linked open relationships. Sometimes, an encounter allows the LWP project team to get only as far as identifying that an alternative data set exists or can be aggregated, thus we can mark its parameters, and set out to complete it in other ways. At other times, an encounter helps us imagine alternative sources of data when our expected results fail to appear in LOD searches. We are learning as much about how to construct, arrange, and manage optimal data sets as we are about how to optimize methods for representing our data. We are also experiencing, first-hand, the difficulties of one of LWP’s principal goals, which is to limn the dis-connections between pedagogues, their institutions, their archives, their communities, and other documentary evidence of their public and private work.
Separately and together, we have been considering alternative visualizations to simple clustering relationships. How do we gather, geospatially organize, and portray the temporally dynamic—sometimes overlapping—careers of these pedagogues without falling back on a clustering logic? How do we show where they are absent and not only where they are present? How do we reflect dispersal, and capture both the centrality and the decentralization of the many data sources that hold clues to our subjects’ whole careers?
To be clear, visualizations based on first-order logic (i.e., X has Z in common with Y) are immensely helpful in assessing the traceability of one or more figures, but they may still privilege time and place as stable entities, whereas LWP relationships hope to disrupt these stable ideals. Moreover, knowing that the kinds of data patterns we seek are usually considered tangential to the kinds of patterns that are most easily achieved through proprietary visualization tools, how can our visualizations raise new possibilities for what is traceable at all?

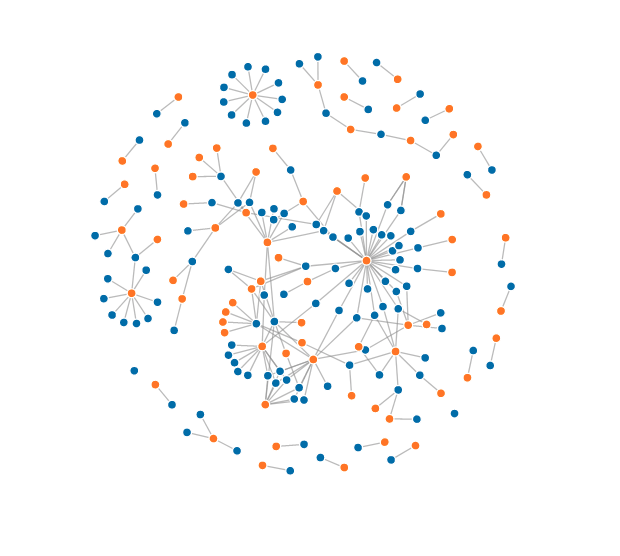
Fig 1: The original template for Mike Bostock’s disjoint force-directed graph. Orange nodes reflect cited patents, blue nodes reflect cited works. The edges connect a patent to a work where the patent is cited. Nodes and edges are both moveable, but the force directed aspect of the graph helps keep them positioned within an unseen circle shape.
Lately, we are exploring disjointment. Disjoint connections (Fig. 1 above) allow us to represent pedagogues in shared roles or relationships without also flattening the roles that are unique to their individual careers. The concept of data visualization is intended to create an understandable graphic that can simplify the amount of data but also discover new patterns, yet modeling visualizations are often constrained by the number of factors (depicted as nodes or edges) that can be simultaneously displayed. This is especially true of the LWP’s principal data set, which is a growing csv file that contains data found in, or scraped from, multiple archival and web-based sources, gathered by a small team of collaborators at Florida State University, allowing us to document as much information as possible for any single pedagogue. Each pedagogue is assigned a separate entry to correspond with each of her roles (e.g., author, co-author, editor, president, vice-president, literacy instructor, community activist, professor, administrator, associate dean), and each role is further described according to its affiliations, citations, source documents, and presence (or absence) in other LOD tools, resulting in an extraordinarily large set of values that demonstrates the breadth of these women’s careers.
While the master set is too unwieldy for visualization on its own, Marcelina has been experimenting with smaller subsets of data to figure out how our data representative models might better accommodate multiple values in relationship with one another—how a single model might balance the depth and duration of a pedagogue’s career. The smaller data sets begin with just the names and found roles of the pedagogues, before we layer on the various organizations and institutions they served, as well as their length of service, signified by start and end date
The visualizations below (Figs. 2 and 3) show two of Marcelina’s prototypes. At a glance, the force-directed graphs look like any other network graph or clustered visualization, but they function according to malleable positioning forces, rather than a single centering force. The disjoint connections, signified by the grey edges that are responsive to temporal shifts and shifts of value, allow pedagogues to be connected to one role that they share for a period of time, or to be connected to other pedagogues that each have roles unique to them. Furthermore, we can integrate the sources of their records, whether archival, institutional, bibliographic, or real-time, without the expectation that those sources need to operate the same way for all subjects. For the LWP project team, this means we can begin to consider visualizations that won’t omit crucial information for their users, such as whether pedagogues who held the same position in the same organization were catalogued differently, and why, or whether some pedagogues were employed by the same organization in the same role, but in necessarily different capacities and at different stages in their careers.

Fig 2: Disjoint Force-Directed Graph of Women Pedagogues and their Roles. Marcelina’s modified template of Bostock’s Disjoint Force-Directed Graph using a subset of LWP’s data. Blue nodes represent pedagogues, orange nodes represent their various roles, and edges connect pedagogues to various respective roles.

Fig. 3: Disjoint Force-Directed Graph of Women Pedagogues and their Organizations. Marcelina’s modified template of Bostock’s Disjoint Force-Directed Graph using another subset of LWP’s data. Blue nodes represent pedagogues, orange nodes represent the organizations where they held leadership positions or professional membership, and edges connect pedagogues to their respective organizations.
In another Encounter, we describe this process in more detail, including how a disjoint force-directed graph can incorporate time without being constrained by it.
—T. Graban and M. Nagales